Visualize the Markets: NASDAQ-100 Returns in 2024


Okay, so we've done a couple of data visualizations so far.
Here we studied the relative size of all major global exchanges. Here we did the relative market caps of major North American indices constituents.
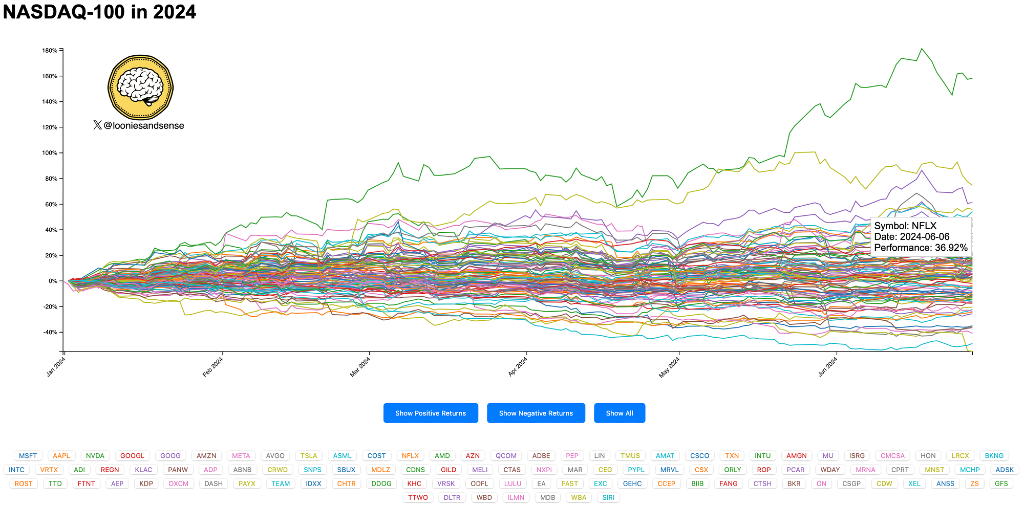
This time, we're going to look at the NASDAQ-100. Specifically, the relative price returns of the constituents from the beginning of 2024 until the date this was published (roughly six months). It's an arbitrary choice of timescale.
There are no prizes for guessing which constituent has the highest returns year-to-date!
You'll notice price is normalized for all constituents at the beginning of the year and deltas are expressed as a percentage. There's absolutely no point in plotting stock prices as their nominal values are meaningless. We're just interested in price delatas (which equate to returns), so percentages work.
What is the NASDAQ-100?
I think it's worth mentioning what the NASDAQ-100 is. Of course, it's an index. But it's designed to represent non-financial companies traded on the NASDAQ. Continents cannot be classified with a financial sector code per FTSE ICB categorization to enter the index.
Constituents must have good liquidity, measured as trading > 200,000 shares per session or > $5m/day for at least three months.
Constituents must have a U.S. operating company to be included.
If you issue more than one class of security and you are eligible for inclusion in the NASDAQ-100, each equity class will have its own symbol. An example of this is seeing $GOOG and $GOOGL. They're just the class A and class C issues from Alphabet, not separate listings or issuers. However, you do not sum the market cap you see under each symbol. I haven't removed different share classes from my data for this visualization.
It is not a "tech index", although it is currently ~65% of companies that might qualify as technology-oriented. There are tech ETFs that may provide superior returns to the NASDAQ-100 if your focus is tech, such as $XLK:
The NASDAQ-100 is also not truly cap-weighted, contrary to popular belief. The cap weightings are skewed to avoid over-concentration in some of the bigger names. It was rebalanced last in 2023 to lessen the effect of the "Magnificant 7".
No single name can ever exceed more than 24% of the entire index. As a further safety valve, companies with weights > 4.5% cannot constitute more than 48% of the entire index.
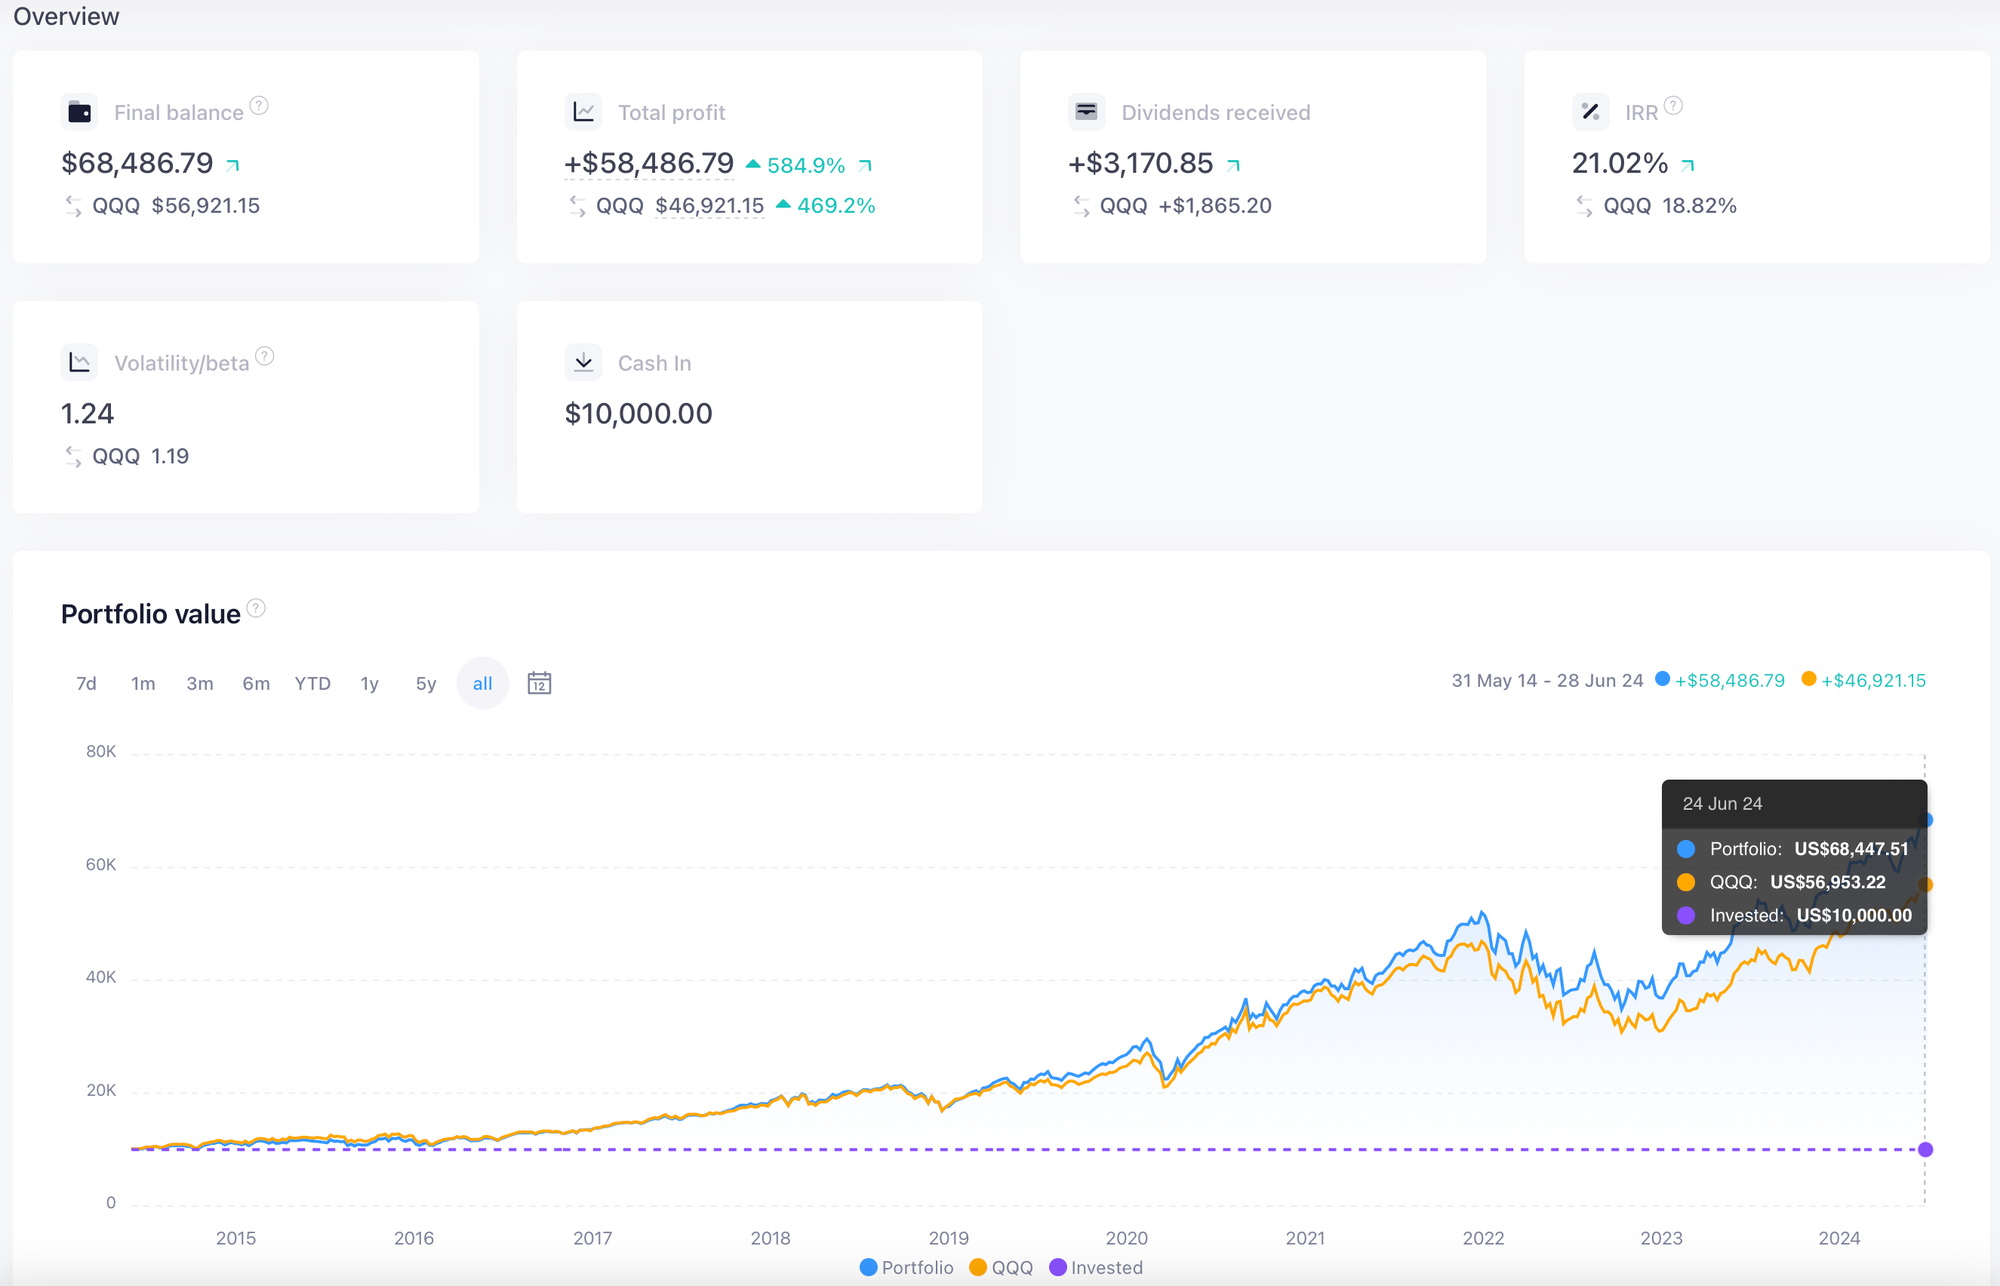
I come across a lot of folks who refer to the NASDAQ-100 as "$QQQ", which was the first NASDAQ-100 benchmarked ETF. The official NASDAQ-100 ticker is $NDX. Of course, you cannot buy an index, so that's where $QQQ and a host of other ETFs come into play.
What Can We Learn From the Data?
- Even though the NASDAQ-100 has outstanding returns this year, it still has plenty of dogs.
- Since the beginning of the year, excluding the outlier $NVDA, returns are roughly split half-and-half between positive and negative.
- $NVDA's performance has been phenomenal.
About the Data
I wrote a piece of node.js code that pulls market data for all the constituents of the NASDAQ-100 each trading day from my market data provider. We're using close price as that's most meaningful. There was one data anomaly that I cleaned up manually – I'm not sure why it occurred and I haven't been motivated enough by this to open a ticket with my data provider.
For the Technical Folks
As usual, this is built in the fine D3.js data visualization framework in JavaScript. I built the market data as a JSON file which is imported.
Click on the image below to use the interactive version. This is unlikely to work well on a mobile. You can click on the stock symbols to highlight a particular name. You can mouse over any line to see the returns at any point in time. There are also buttons to show what's up and what's down YTD.
Feel free to give me some feedback on X if you enjoy this, or have something you'd like to see!
Whilst every effort is made to make sure this information is complete and accurate, it is not advice and you should talk to a professional about your circumstances.