Many Happy Returns
What are investment returns and how are they calculated? How is investment performance measured and what does it involve? What level of returns is necessary to recoup a loss within a reasonable timeframe? What is sequence of returns risk and when should one be concerned about it?


What are investment returns and how are they calculated? How is investment performance measured and what does it involve? What level of returns is necessary to recoup a loss within a reasonable timeframe? What is sequence of returns risk and when should one be concerned about it?
In this post, we're looking at stock market returns. There are both diagrams and an interactive tool that you can play with yourself. It's a wordy post, but I didn't want to split it up. Let's dig in!
Investment Returns Defined
Investment returns are the money over and above the capital you invested.
Stock Market Returns Don't Look Like This
Below we visualize returns in a "straight line" fashion where market volatility is zero. In math and finance, we refer to this as an "arithmetic returns curve", but it's really an exponential function.
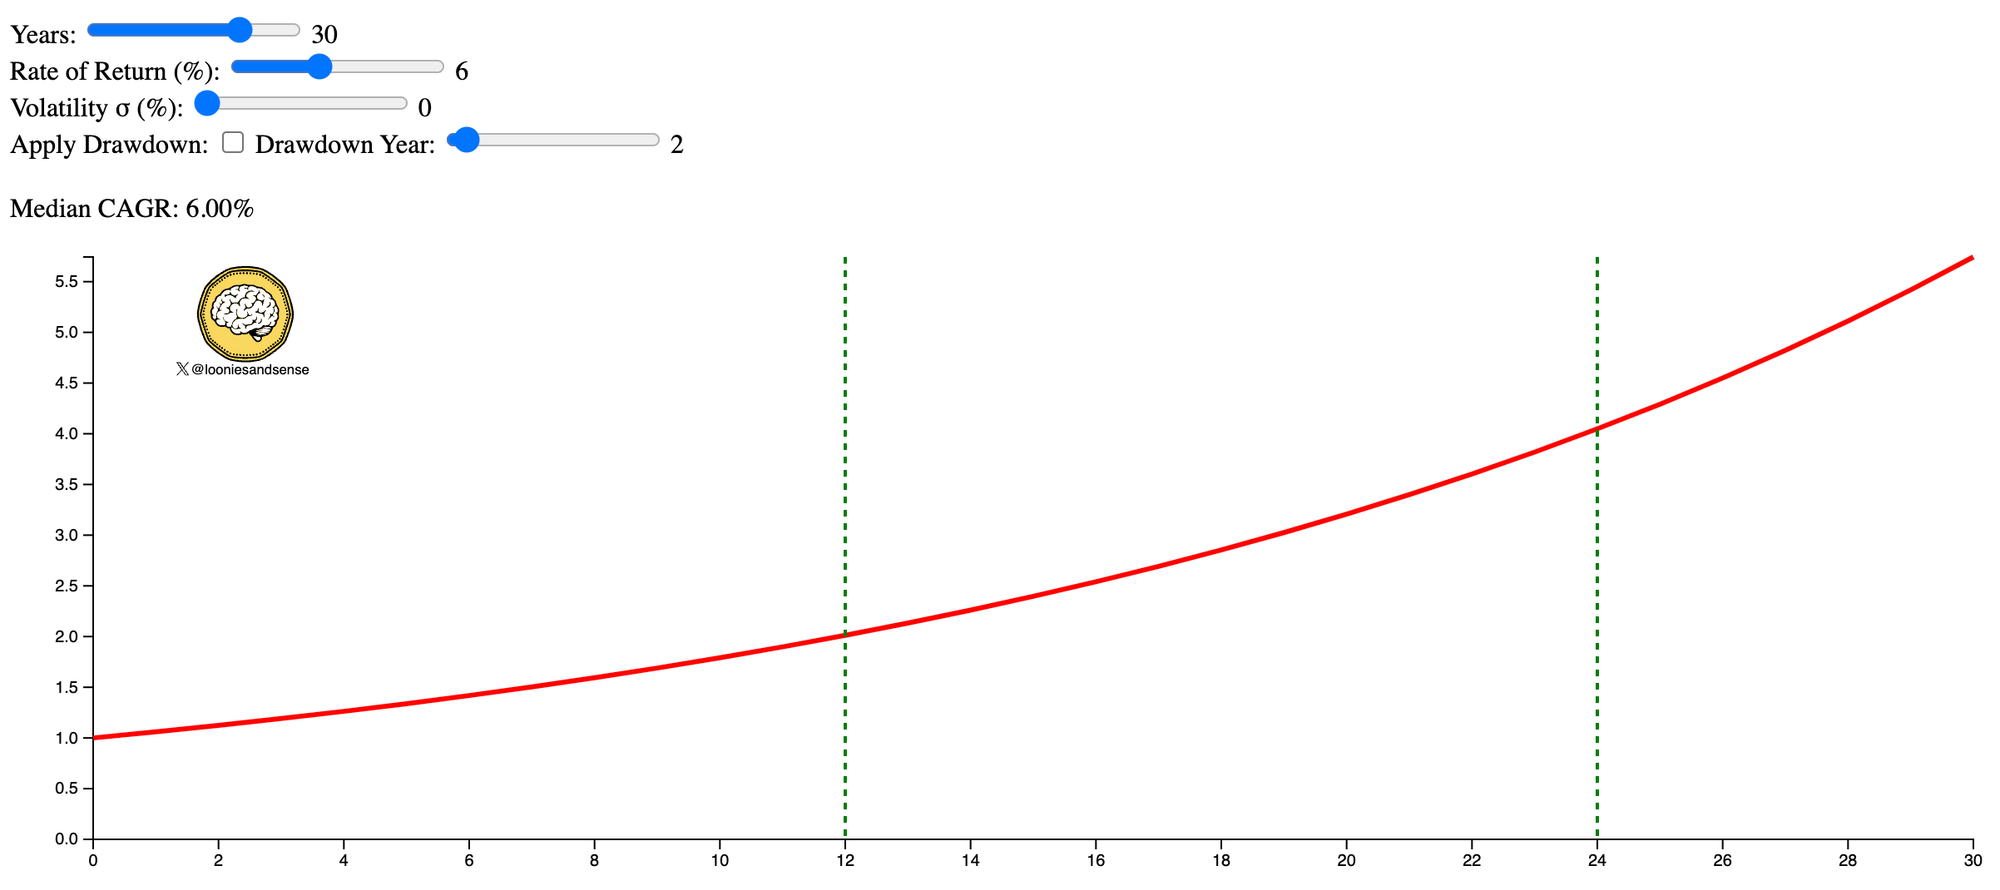
However, this is not what returns look like in the real world! But I note that many people post graphs like this on 𝕏 to predict their portfolio growth or to demonstrate compounding. It can be hazardous to plan your future this way, and we'll get into that a bit more below.
The takeaway is not to use a savings calculator. The math doesn't quite work that simply.
What Returns Look Like Due to Volatility
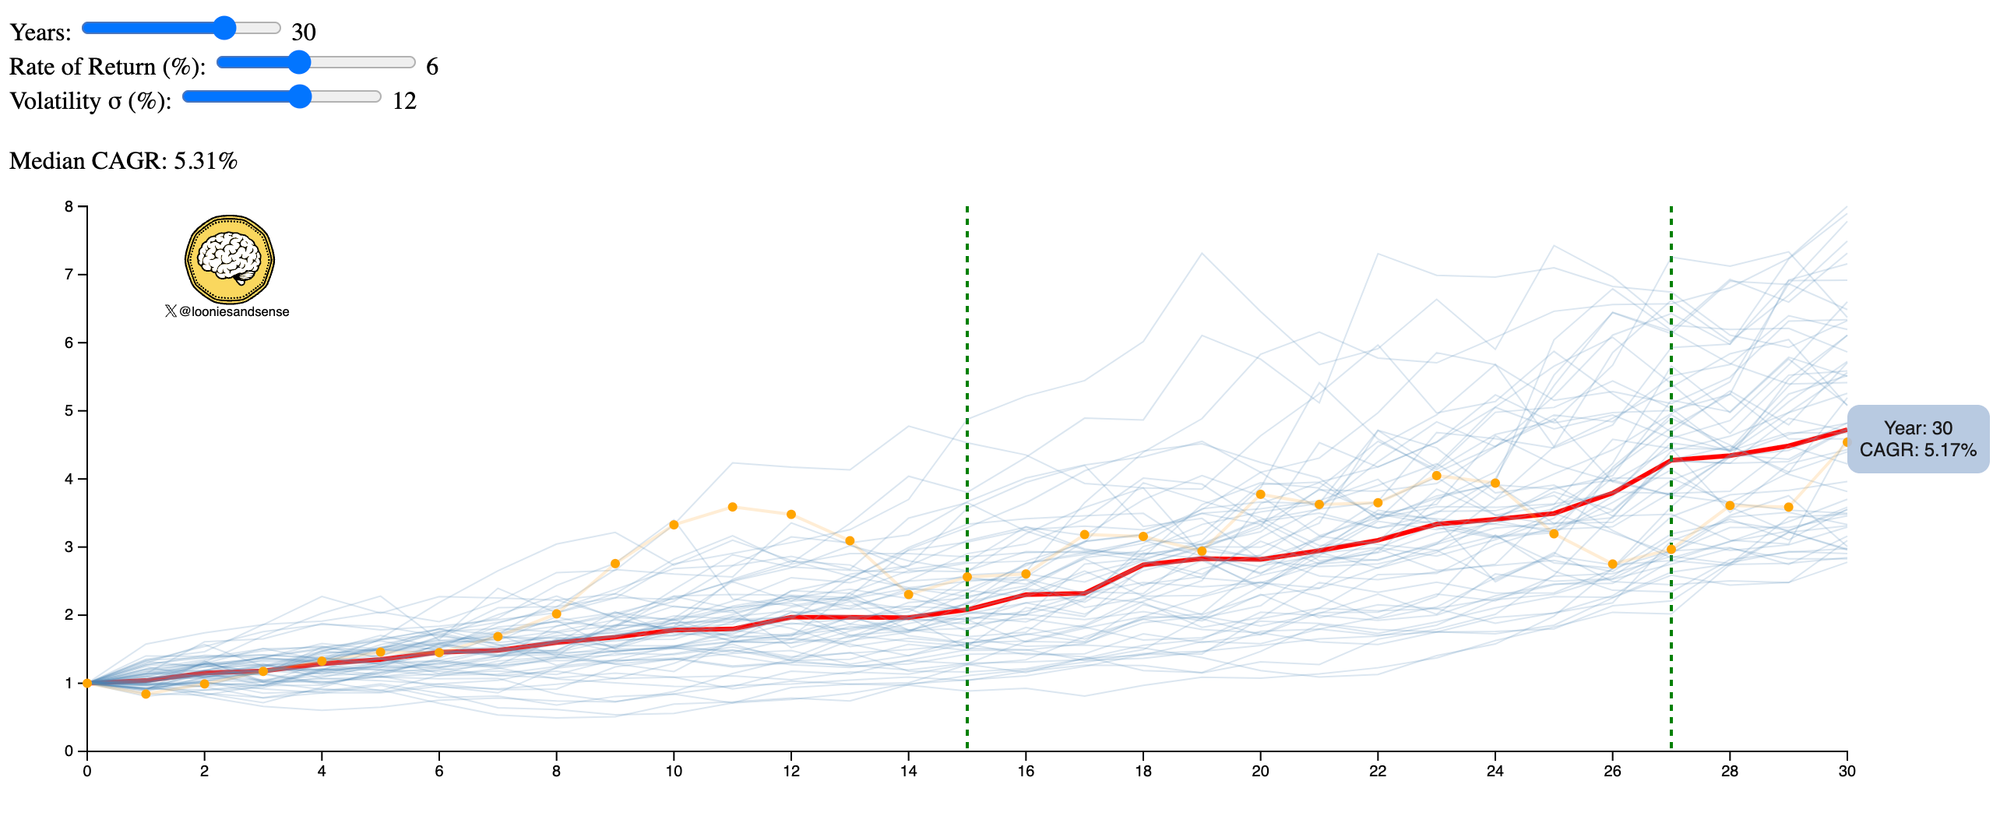
Volatility affects your returns. It adds randomness in the up and down movements of a stock. You've seen this: some days your positions go down, and some days they go up. You pray they go up, on average, over time.
The tool I built also incorporates something called a Monte Carlo routine. This random mathematical routine tries to approximate the random up-and-down movements of the stock market or a single stock. If we run it many times, we can get an average (median) of what you might expect returns to look like. I stress that this is not an exact science and many things might affect your returns, especially for a single stock. Do not use this to try and estimate your retirement portfolio!
If you look at the diagram above, each light blue path is a randomly predicted returns scenario. I would call this a "walk". You can see many of these blue lines; each one is a possible path the stock or index could take based on the original inputs. There's a huge variance and this is caused by volatility. The green dashed lines are portfolio doubling time - the time it would take to double your original investment given the median return.
Financial planners and advisors often use Monte Carlo simulations to estimate the chances you'll hit a retirement goal. In capital markets, we use them too, but as trading signals.
If you were to mouse over a blue path, you'll see it turn orange and circles appear to represent end-of-year returns. There are ups and downs, but the general trend is upward. The ups and downs are caused by volatility ("sigma' or σ if you speak math). The more volatility, the more it affects returns given the same inputs. If you slide the volatility slider back and forth, you can see that. You will also notice a rectangular box appear that calculates the return for that path over the period.
But you also can't invest without volatility. The unpredictability of stock market returns is part of what generates a premium in the first place. You wouldn't get a premium without the riskiness; you'd get the equivalent of cash returns.
That said, you also don't want too much volatility. One of the reasons I encourage people to invest in broad market funds (i.e. global equities asset allocation) is that you always approximate the volatility of the whole stock market. This is the Goldilocks setting for your portfolio without any work on your part from a risk management perspective.
When we calculate returns that have volatility we refer to them as geometric or geometric mean returns because we have to take into account the up and down price swings of the underlying security or securities.
Do pay attention to the above image or play with the tool yourself. Each path is mathematically possible and it's impossible to know in advance. That dividend newsletter or Seeking Alpha article you have just read doesn't give you any insight here that's not already priced in!
How Are Investment Returns Measured?
So now that you've seen what returns look like, how are they measured? Confusingly, there are several common ways to measure investment returns. I'll highlight the ones that you should probably focus on.
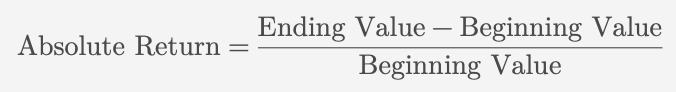
You might already know about absolute returns. You simply divide the ending value minus the beginning value by the beginning value like this:
The problem is, they're not incredibly useful. If I told you I made a 30% absolute return on a stock, you might think that's great. If I told you I bought the stock in 1972, you might change your mind. There's a temporal element to returns that this does not capture.
To better capture the temporal element and also for them to be indicative of consistency, we can use annualized returns. The one you're already likely familiar with is CAGR (Compound Annual Growth Rate):
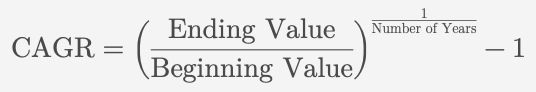
The great thing about CAGR is that it expresses long-term performance and sub-par years of returns will lower your CAGR.
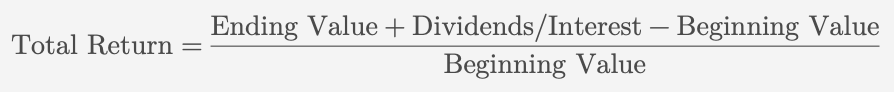
If you follow me on 𝕏, you'll notice I talk a lot about total returns. It's even in my bio. Total returns accommodate not just capital gains (appreciation in the size of your position versus cost), but also any interest, dividends, or distributions received:
Money-weighted rate of return (MWRR) takes cash flows into account. Investment rate of return (IRR) is the same thing. Because it takes cash flows into account, it's suitable for calculating the rate of return when income is involved.
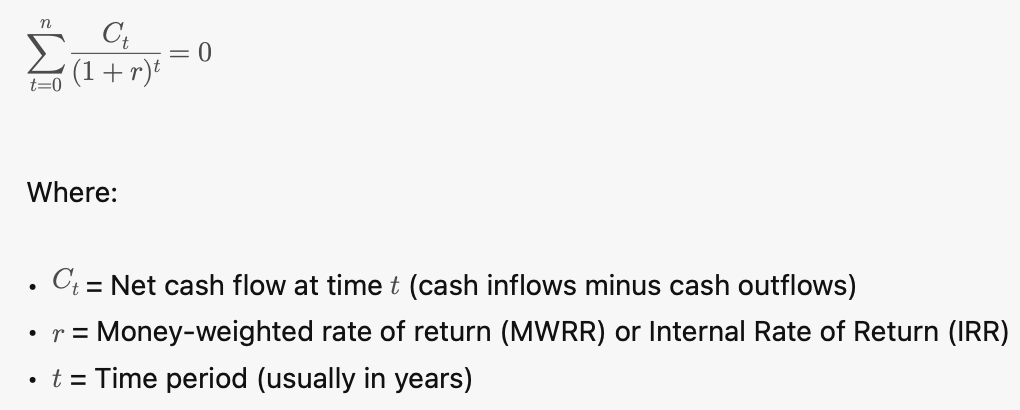
MWRR or IRR is only accurate went the cash flows involved are on fixed periods. If you had sporadic cash flows, such as various dividends arriving every three months on different dates, you would be better off using Extended IRR (or XIRR).
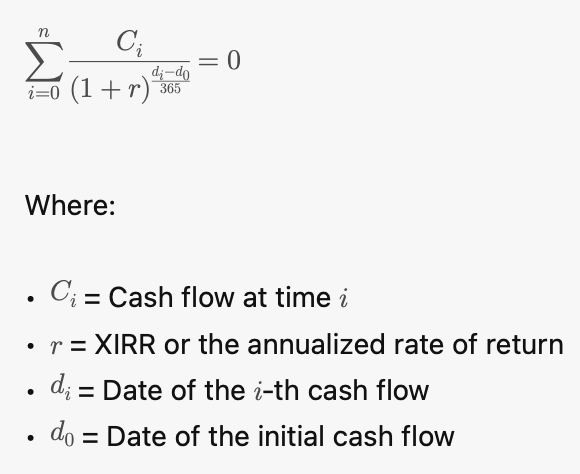
Finally, the Time-Weighted Rate of Return (TWRR). Some brokerage accounts calculate your performance this way. You can figure out your XIRR per the above and use that as an input for TWRR. TWRR neutralizes cash flows. In simple terms, you won't see the effect of cash flows in or out, just the raw performance of the investment.
You don't need to understand most of what's written above. And you certainly don't need to figure these things out by hand. There is a heap of calculators on the internet, and Excel and Google Sheets can both calculate these too. But being familiar with the way they work and which one is most appropriate helps.
Another approach to performance measurement is comparison or benchmarking. For example, if you are investing in large-cap Canadian stocks, benchmark against the TSX/60 as it's an index of large-cap Canadian stocks. If you are not consistently able to outperform this index, you might want to revisit your strategy and just buy the index instead. This should be done on a total return basis and you can go to the S&P Global site to look at the TSX/60 TR index. Also remember that if you're beating your benchmark wildly, you may have also taken on more risk than necessary.
Drawdowns and Sequence of Returns
It feels like stating the obvious, but drawdowns drag on your returns in the near term. They're inevitable. There's so much entropy in the stock market that it's unlikely you'll know about them before they happen.
Why don't drawdowns matter earlier in your investment cycle? Equities often experience a phenomenon called "mean reversion". They want to drift back to their mean average. During the 2020 pandemic drawdown, we saw markets drop significantly in March and recover by November (with a little quantitative easing help, of course). Global equities recovered from a significant drawdown in 2022 to go on to new heights in 2023.
But, as I mentioned, if you are close to decumulation things are different. That could be retirement or your children's college savings. This is where uncorrelated assets such as fixed income come into play. You can start blending them into your portfolio on a target-date basis to reduce risk. Imagine keeping a child's RESP 100% equities and experiencing a major drawdown in the 2nd year of college, or seeing 30% of your retirement savings disappear a year before retirement? Fixed income (bonds) are an uncorrelated and relatively stable asset, so they help buffer your equities portfolio.
I pre-engineered a returns drop into the data visualization tool I wrote. If you set sigma (volatility) to zero, you'll see that a 20% return drop will appear and you can move the year it starts using the slider.
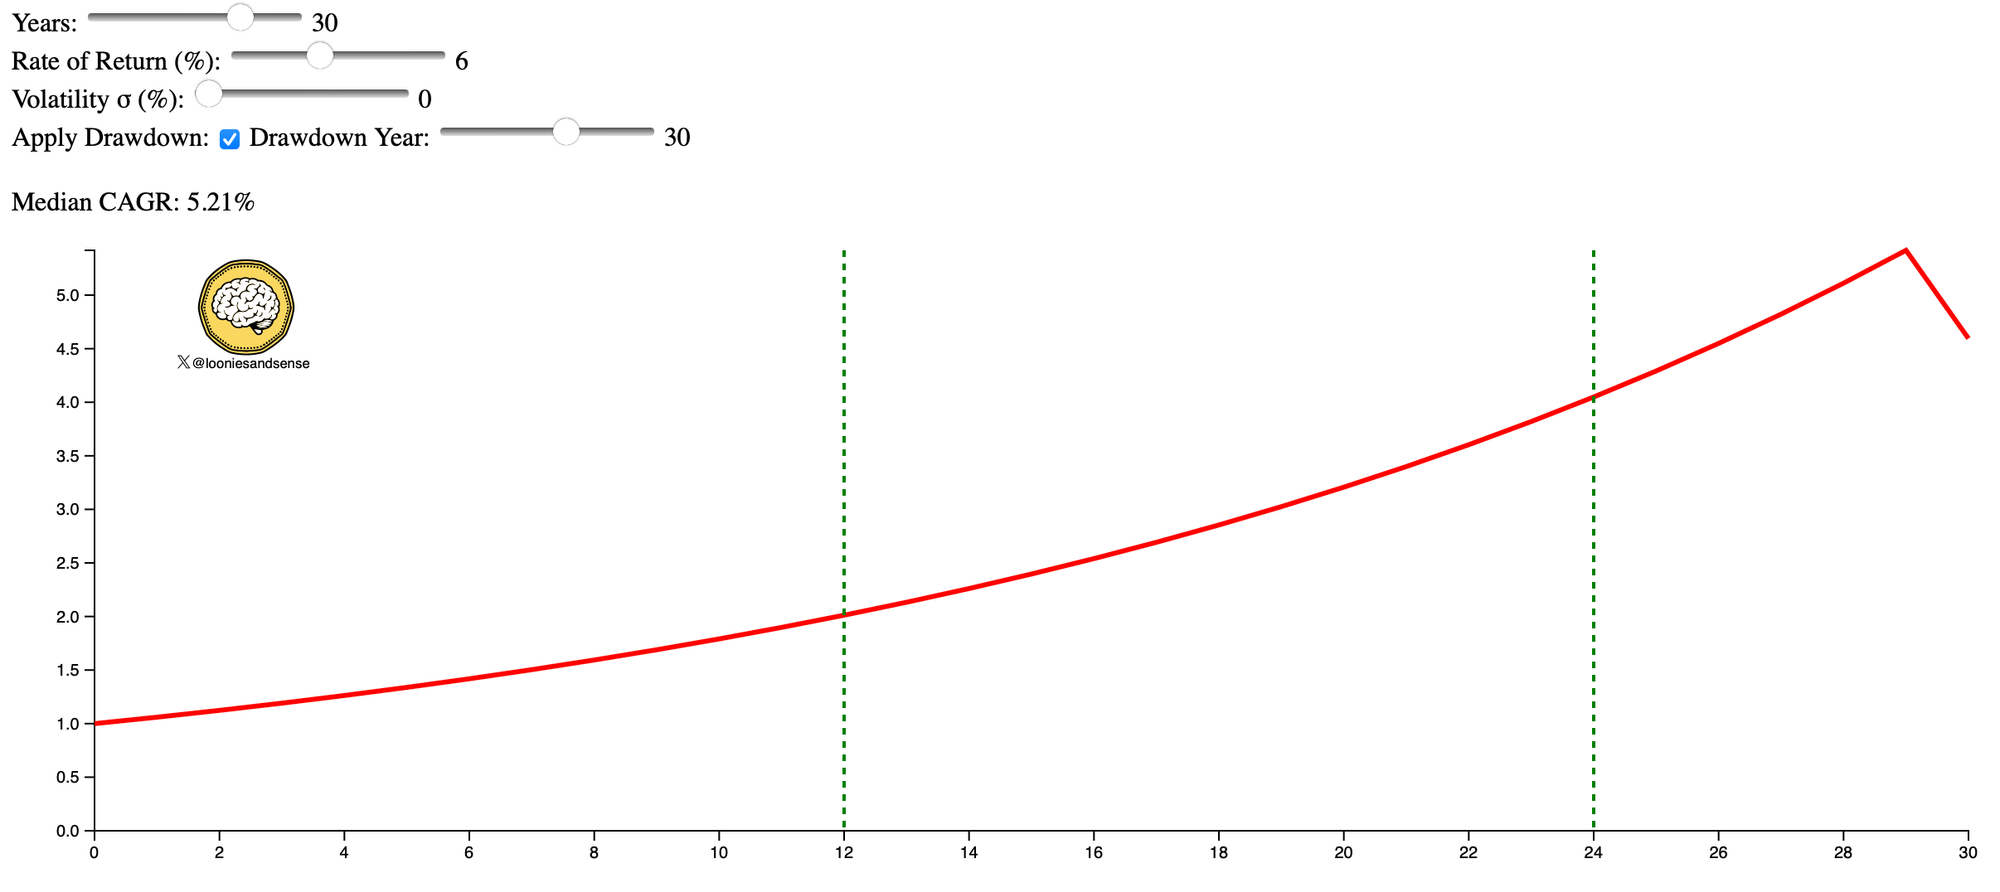
Move the slider back and forth. It doesn't matter what year you set (as long as it's not the last one before the end of the period), you'll always get the same CAGR. The sequence that you get your returns in over an investment horizon doesn't matter as long as we see mean reversion quickly after a drawdown.
But if you slide the drawdown right over to the final year of the simulation, you'll notice it dramatically affects your returns. In the example above, we go from a straight-line return of 6% over the investment lifetime to 5.21%. That doesn't sound like a lot, but you end up with 20% less money.
Trading: "Your Money is Like a Bar of Soap"
You might not think of trading as affecting your returns. However, trading in and out of positions has been shown to damage long-term wealth creation. Eugene Fama famously quipped that "your money is like a bar of soap, the more you handle it, the smaller it gets".
Finding a simple plan that you can stick to, even if slightly sub-optimal, often trounces trading in and out of single names. Broad index ETFs can help many people here if they don't want to roll the dice.
Cost Averaging
Cost Averaging (CA) or Dollar Cost Averaging (DCA) leads to geometric mean approximation and in many market conditions leads to lower returns versus lump sum investing given a suitable investment horizon. Geometric mean approximation means when you buy low and buy high, you're smoothing out your returns. Multiple studies have confirmed with real-world data that a lump sum generally has better returns given a suitable investment horizon. Here's an easy-to-digest study from Vanguard.
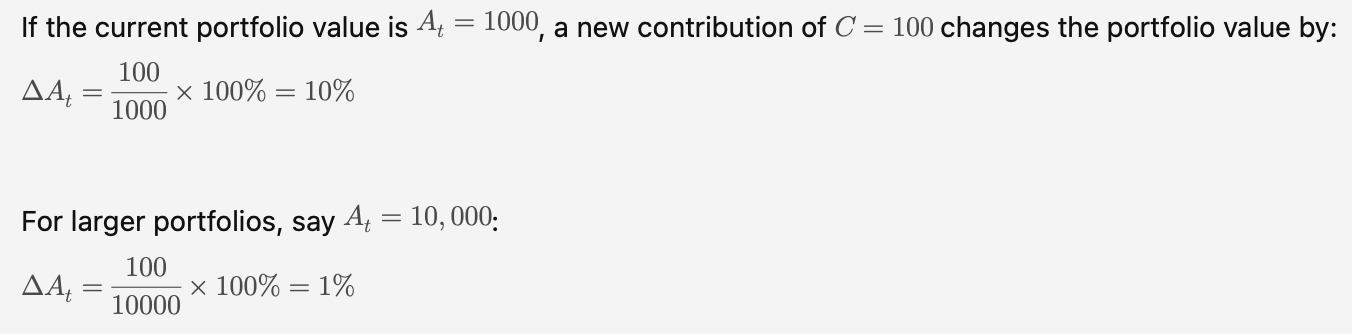
That said, if you are investing your paycheque every week or month, go for it. But, do bear in mind that the effect of "averaging" this has on your position or portfolio diminishes over time. You can see in the equations below that if you're making a $100 contribution to your investments when your portfolio is $1000, that has a 10% impact. When your portfolio is $10,000 and you're still making $100 contributions, that impact is now only 1%.
In a nutshell: investing your paycheque is fine, but don't count on a major impact of "averaging" as your portfolio grows relative to the contribution size. If a stock price drops dramatically, the only way to capture most of that price impact is to make a contribution that's large in relative size to your existing position.
Inflation
There are two types of investment returns: nominal and real.
Most folks think in terms of nominal returns. This is what you'd see against a position, or in the performance section of your brokerage statement.
Real returns take into account both the nominal returns and then subtract inflation. They are a far more realistic way of calculating things because your buying power erodes over time. The Principle of Time Value of Money tells us something should cost more in the future than today and inflation mostly drives that statement.
Periods of high inflation damage your portfolio greatly. In Canada, we've seen a few years of quite high inflation. That dividend increase of 4% you got in 2022 is nothing compared to the 6.8% headline inflation for the year.
Let's look at a real-world example. Lots of folks know about the "Lost Decade" in the early 2000s. The U.S. large-cap bubble burst during the dot-com era. Lots of people know this was a major drag on returns for roughly a decade. But what happens if you add inflation to the mix?
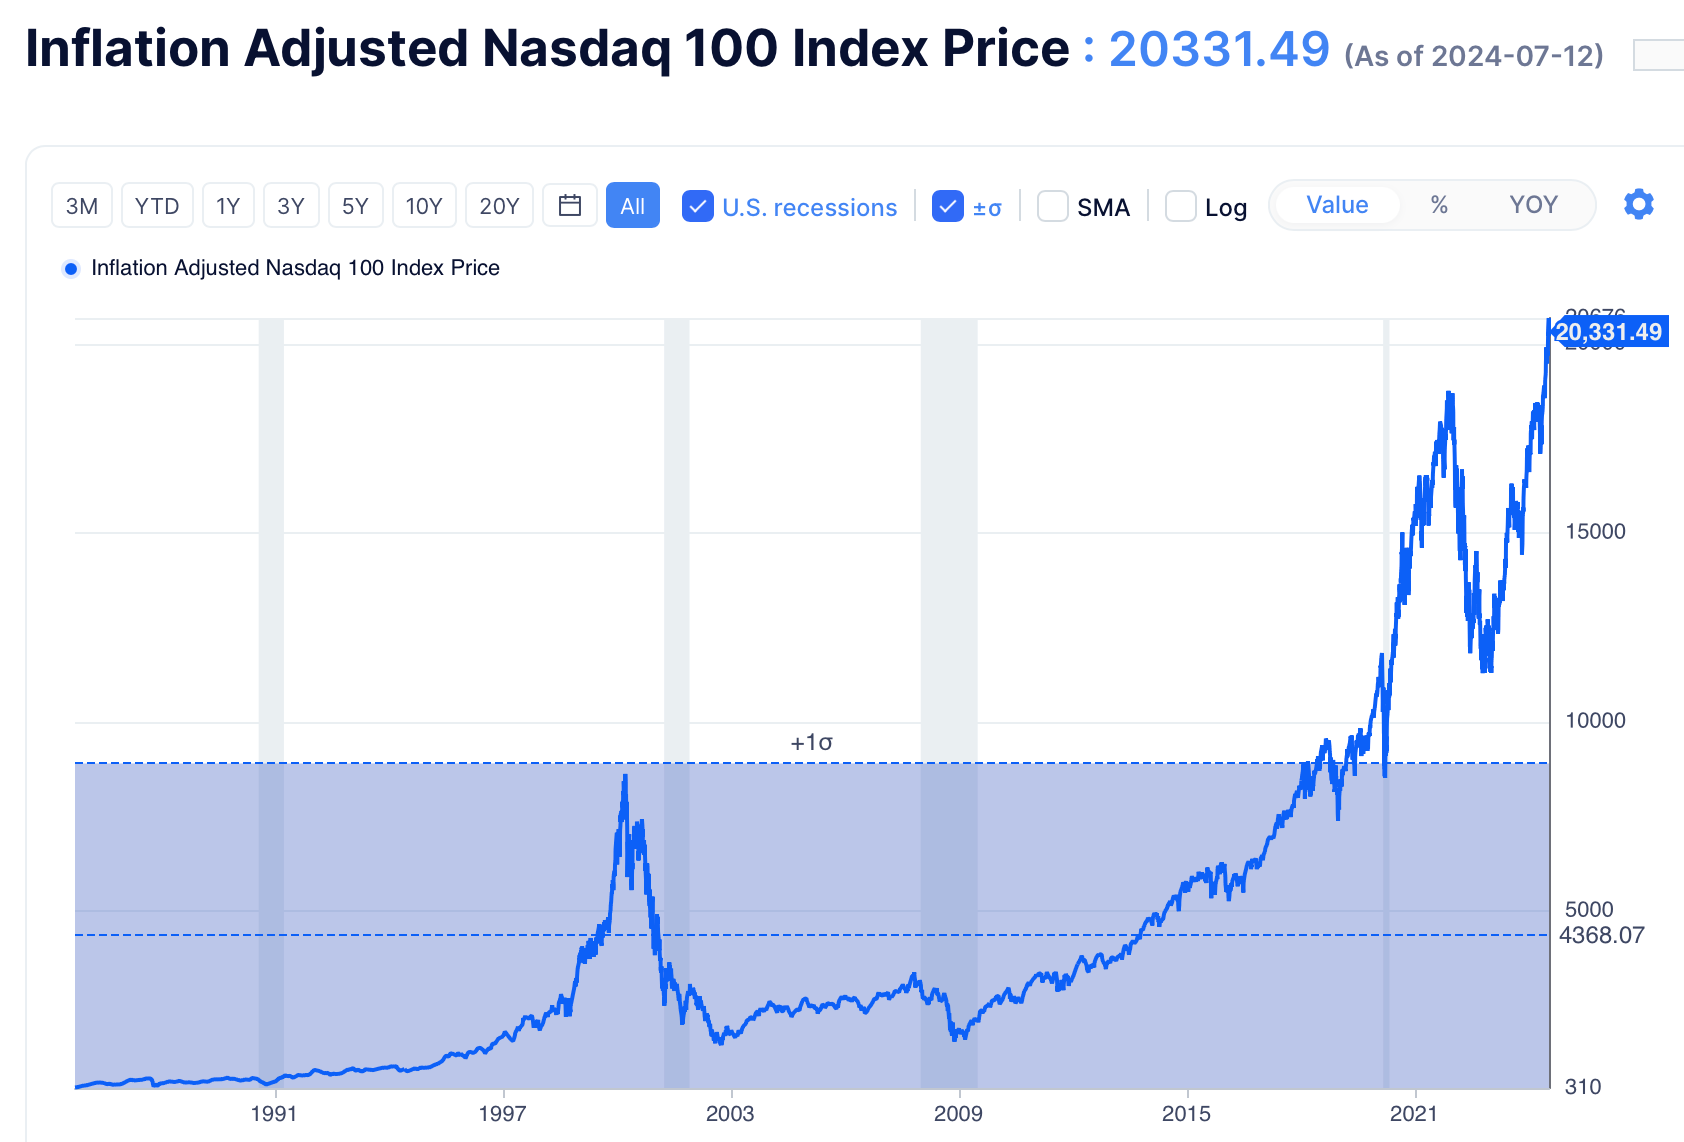
If we look at the tech-heavy NASDAQ 100 ($NDX) and adjust it for inflation, you can see that if you were unlucky enough to YOLO into the market at the peak of the dot-com boom, you wouldn't have gotten your money back until late 2017 on a breakeven basis. Almost two decades before the money you invested had the same purchasing power as when you invested.
Of course, some contend that if you invested after the boom, you did quite nicely. But notice how flat the first decade of returns is when you factor in inflation. Your money just didn't grow during that period.
While you don't need to calculate your investment returns on a real return basis constantly, it is good to be aware of what inflation does. One of the things I talk to dividend investors about is that dividend increases of 3% or 4% barely outpace inflation and have been less than inflation in the past couple of years.
Risk-adjusted Returns
Many people look towards past performance as an indicator of what they should invest in. This, of course, is wrong. Past performance is not necessarily a good indicator of future performance. Even well-run companies can come off the rails, pandemics can happen, etc. etc.
Another thing that I think a lot of folks miss is that the premium on a single equity is a measure of risk. This is the equity risk premium. When you get a return greater than cash (say, a short-term bond), this is reflected in the premium.
Diversification at scale lowers your unsystematic risk. You're taking on all bets, big and small, and now your systematic risk is the average of those bets.
Another way to look at this is with the statement, "You invest to maximize returns without undue risk". Sure, you can get 20% annual returns currently from making bets of single stocks, but those are inherently risky bets. By risk-adjusting your returns with diversification, you are getting the best possible outcome for the least effort.
You can look for indicators such as the Sharpe ratio to give you an idea of how good an investment is on a risk-adjusted basis. It's not a perfect indicator, but it's a start.
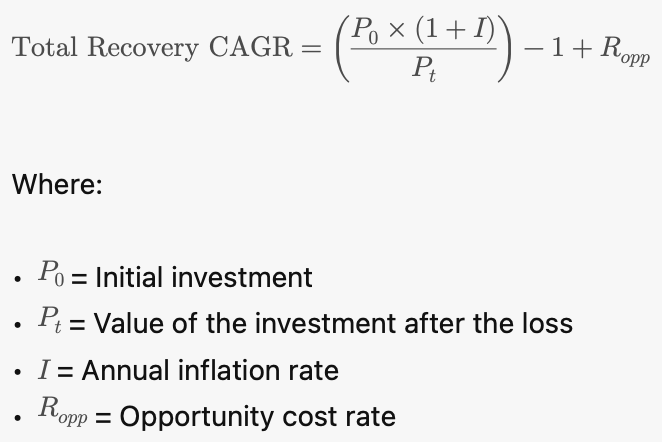
Returns Required to Recover From a Loss
While Buffett famously said, "Don't lose money", it's inevitable that you will eventually have a position that suffers a significant loss if you pick single names. You cannot know everything that can and will happen in advance.
When you have a position that's negative, you need to consider three factors.
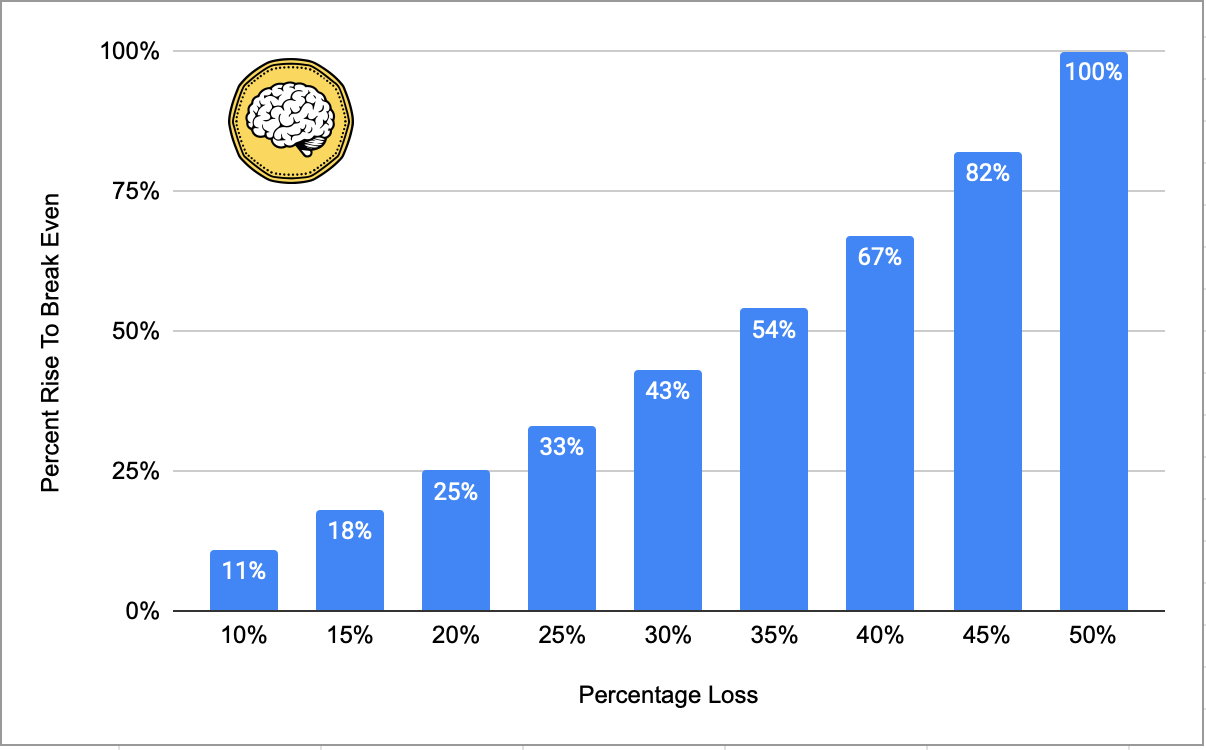
The first is the gain required to get you back to zero. A 10% loss requires an 11% CAGR over a year to recover. A 50% loss requires 100%. The latter is rarely achievable. In my experience, it's best to rip off the Band-Aid sell out the position and reallocate the capital.
But two other factors affect the returns required to get back to where you started. You should factor in the effect of inflation and also look to recover "opportunity cost".
The equation would look something like this:
Let me walk you through an example
You bought $10,000 of XYZ Corp. The value is now $8,000. You're wondering what to do - should I sell the position or wait?
You can work out the CAGR to get you back to zero in the next year with the following formula:
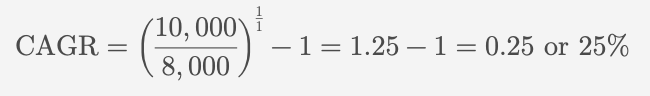
Or just approximate from the chart earlier in this article.
But $10,000 a year from now isn't the same as the $10,000 today. Inflation erodes your investments. If you're not keeping up with inflation, you're losing purchasing power.
Opportunity cost is roughly what you think the rest of the market is going to go up. There's no point in just getting your original investment back to the point where you've recouped your money plus inflation because the rest of the market is (possibly) moving up during that time.
If inflation is 2% (an aspirational figure at the time of writing) and you figure conservatively the market will go up 5% in the next year, you would work out the required recovery CAGR something like this:
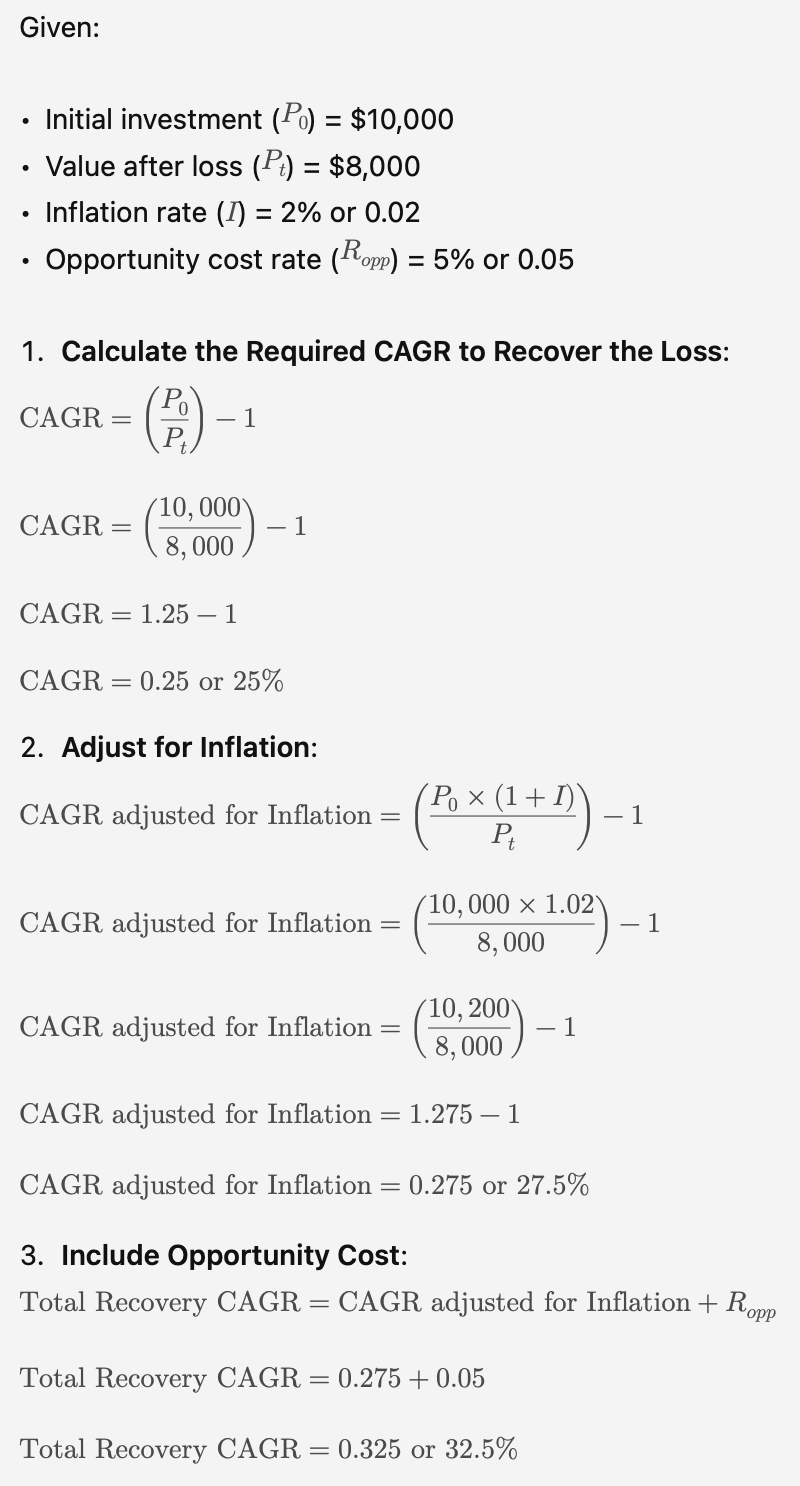
So, with some fairly conservative figures and a reasonable timeframe, you can see that you want to be looking at a gain of ~32.5% for this position over the next year. Again, if you don't have a lot of faith in that happening, sometimes it's better just to sell the position and put the proceeds in something with better risk-adjusted returns.
Of course, knowing inflation and opportunity costs precisely in advance is impossible. This is more of an art than a science. The market could go down in the next year, but I think it's important to be honest with yourself too.
Long-term Consistent Gains Add Up
Hank Bessembinder recently wrote about the best performing stocks of all time. He used the CRSP database to rank them.
Leading the pack is Altria (neé Phillip Morris). Based on his backtesting database, Altria has returned a staggering 265,528,900.62% in cumulative shareholder value. That's not a typo: two-hundred and sixty-five million percent in total return.
But if you dig in to the figures, you'll notice that the CAGR of this stock is a much more conservative 16.29%.
The above is an extreme example (over 100 years of returns) and 16.29% CAGR is also exceptional. But it does illustrate that consistency counts (in large amounts) and time in market matters.
What Are Reasonable Expectations of Returns
If anyone could predict exactly how the market would perform, we could use that as a trading signal and make a killing.
The truth is, we don't know how markets will perform. We don't know what will happen tomorrow.
But we do have around 100 years of market data with approximately 50 years of that being quite clean, computerized data. Using that data we can make some reasonable predictions about planning rates for returns. History doesn't repeat, but it sure does rhyme.
A planning rate isn't so much a prediction, but a safety measure. You don't want to plan your future on the best-case scenario; you want to use a scenario that offers some surety.
Luckily, for Canadians, FP Canada makes available some reasonably well-thought-out planning rates every year.
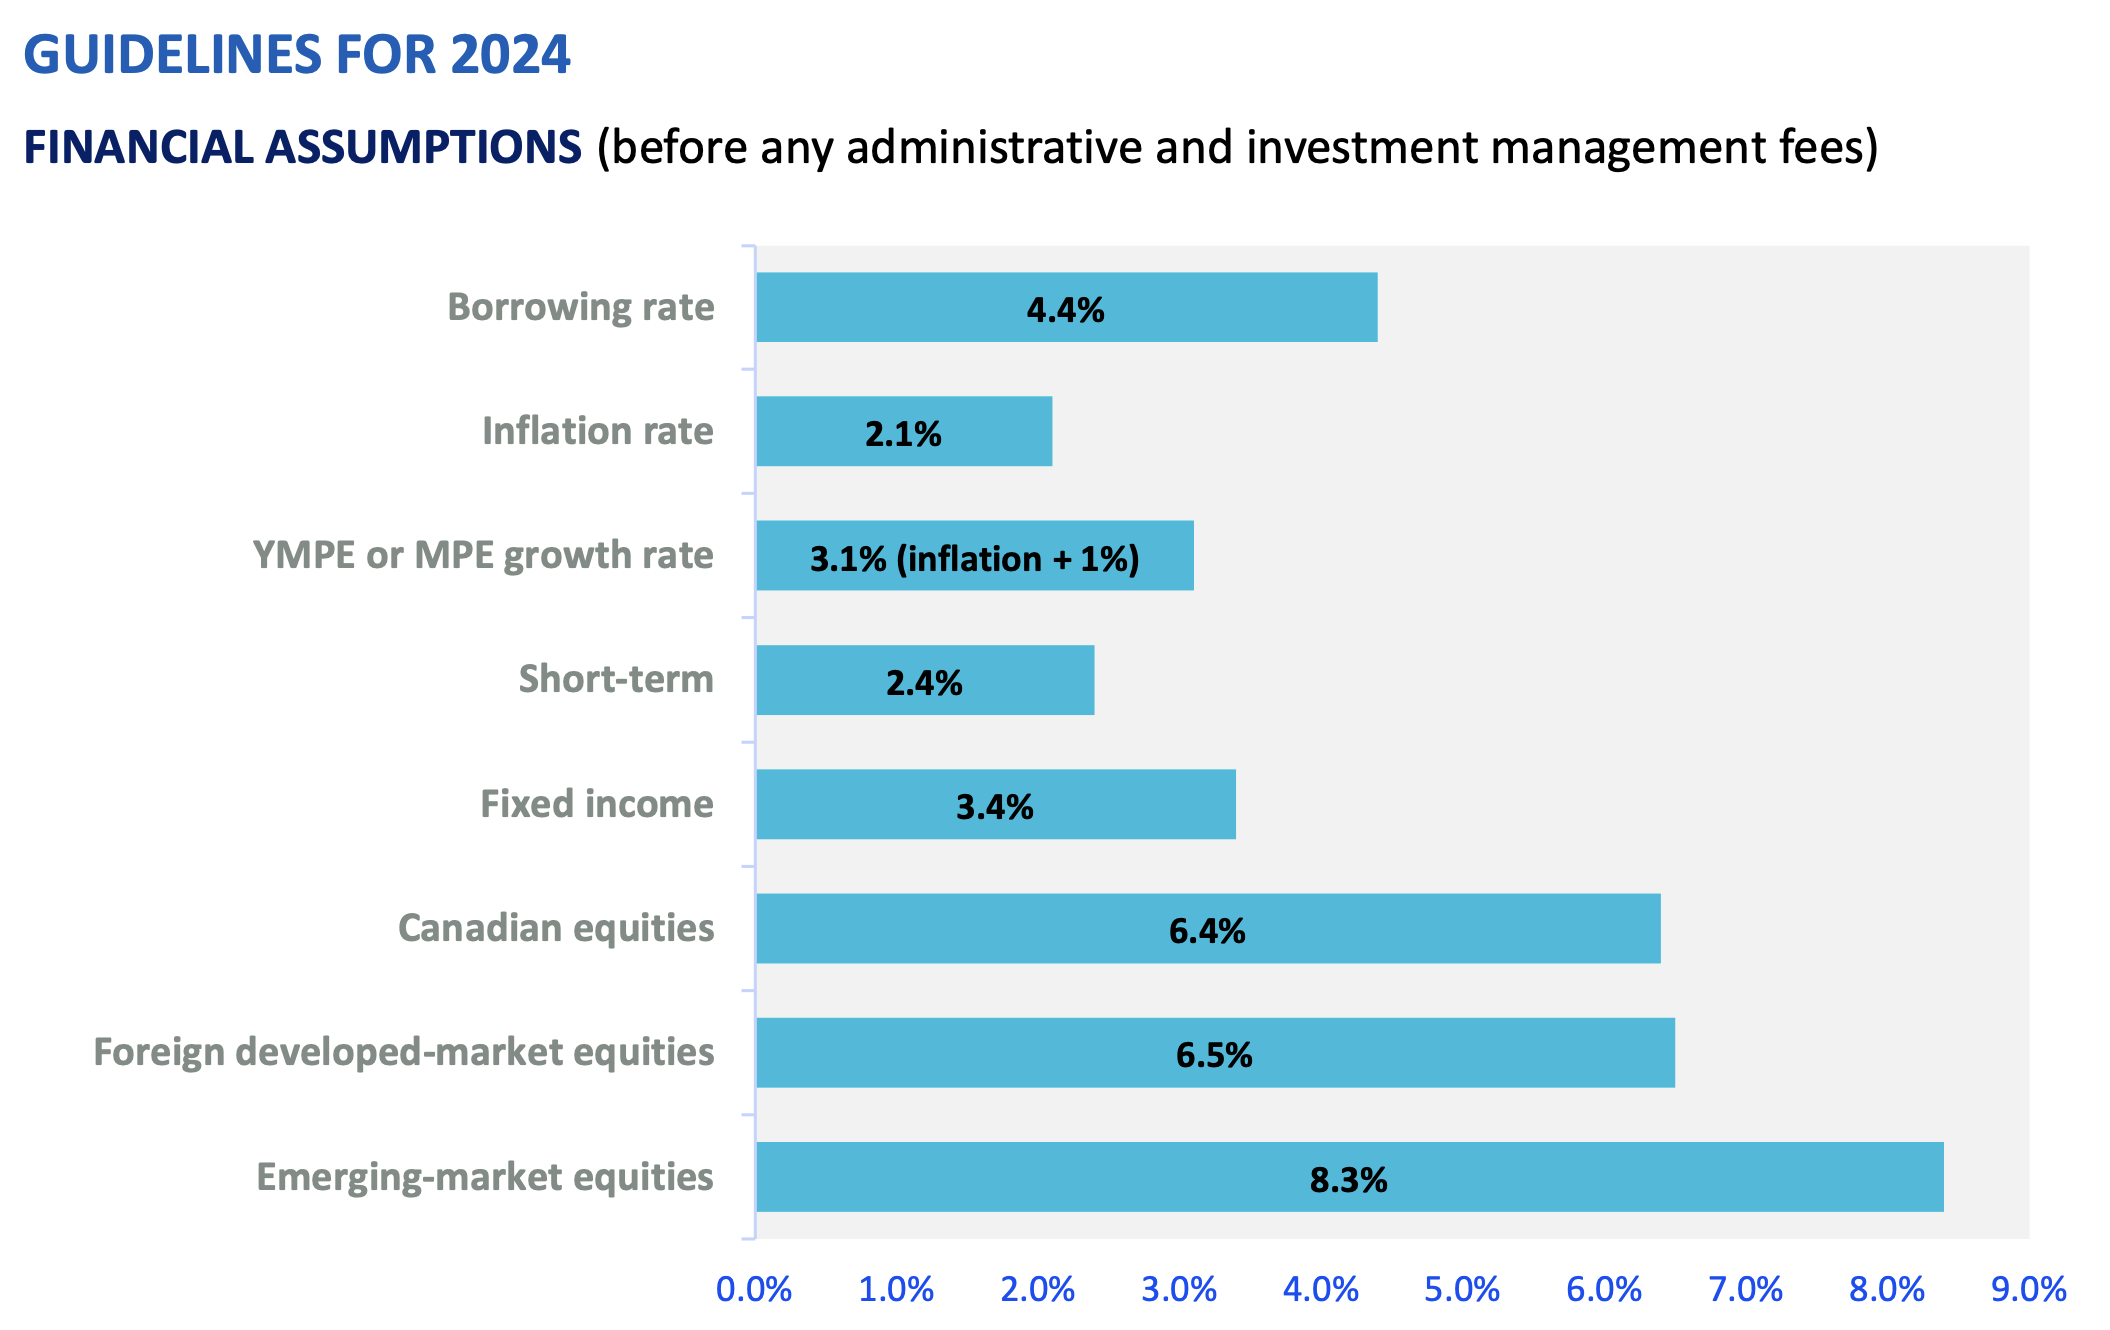
With U.S. markets having been in one of their longest bull runs in history, it's hard to tell people to reset their expectations for the future based on these rates. But, again, they're reasonable expectations that make sure your plans don't go off the rails. Don't look at the above and move your entire equities allocation into Emerging Markets, either!
Given my love affair with BlackRock's $XEQT, I've calculated a reasonable expectation of returns over the next decade in terms of planning rates:
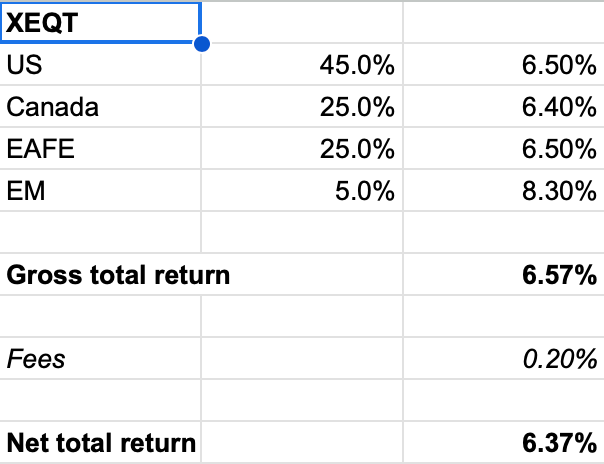
I consider Vanguard's $VEQT to be interchangeable with $XEQT. You may be pleased to know the expected returns are the same if that's your preference.
If you are using the above figures from FP Canada, please note that you should deduct fees to see your net returns just like I did in the example above. Whether that's the cost of an advisor, or MER from a mutual fund or an ETF.
Many Happy Returns to You
What you want from your investment portfolio is years of healthy, steady, reasonable returns rather than wild ups and downs.
I understand that it's tempting to look at past performance and invest that way, but it is like looking in the rearview mirror of your car and trying to drive forward.
Pouring over balance sheets might give you an insight into a company, but the price return of stocks is sometimes irrational. Many, many factors go into this.
You'll hear that all data is always priced in all the time. This is true, although I would argue that the market is still not 100% efficient. But information theory also alludes to the fact that you will never be able to know all of this information yourself, so you will never be able to leverage it. Again, that dividend newsletter or Seeking Alpha article was old news and already priced in the moment you clicked on it.
Your two biggest assets that affect your returns are time and your behaviour. Selecting good investment choices with good risk-adjusted returns and then letting time do its thing.
I wish you many happy returns.
Whilst every effort is made to make sure this information is complete and accurate, it is not advice and you should talk to a professional about your circumstances.